Cartesian Plot
Advertisement
Rt-Science Tools2D for Visual Studio
The selection of components to generate two dimensional Cartesian plots with: unlimited number of axis (secondary axis) manifold options for scaling, grids, legends, automatic scaling, automatic zooming, unlimited number of series, manifold line and point
Advertisement
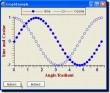
PlotPad v.1 2
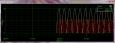
PlotPad is a .net component that provides a visual control to visualize data in cartesian plots. Developers of WinForms applications can easily create xy-, yt- or scope-plots by simply feeding the component with their data.
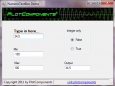
NumericTextBox v.1.0
PlotPad is a .net component that provides a visual control to visualize data in cartesian plots. Developers of WinForms applications can easily create xy-, yt- or scope-plots by simply feeding the component with their data.

ADSS.Plot Control
With this control You can: Draw lines just from arrays. Use gradients to fill lines colors. Draw histograms just by passing two arrays with values. Change look of plot control. Make custom labels for axises. Allow to move and
Plot Digitizer v.2. 4. 2001
Plot Digitizer is a great piece of software developed by Joseph A. Huwaldt. The main goal of the program is to extract information from two-dimensional plots or graphs.
Z-Plot v.1 1
Z-Plot is a free plotting software that allows you to visualize a multitude of mathematical functions and curves. The software has a powerful mathematical formula interpreter, that also allows the user to handle complex numbers, easily.
Free Fall Cartesian Model v.1.0
Study a ball dropped near the surface of Earth onto a platform dynamics. Free Fall Cartesian model displays the dynamics of a ball dropped near the surface of Earth onto a platform.
PSI-Plot v.9.01.0009
PSI-Plot brings flexibility to technical plotting and data analysis. It has a powerful scientific spreadsheet for data analysis, and an object-oriented on screen graphics editor that makes it easy to design and modify graphs.
Fry Plot Program v.1 1
The program developed very useful and versatile in the sense that complete annotation of the plot and caption and legend and printing facility is available in the very program and you do not, unlike other programs, have to export the plot to other pr
DI-Plot v.5 1
DI-Plot has finally closed the gap between prepress and printing in the digital workflow. For the first time, it is possible to achieve a reliable Okay-to-Print based on the original data after it's been ripped and separated.
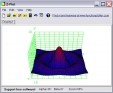
Contour Plot v.1 1
Real contour plots are created in Excel. You can interact with the contour plot just like any other Excel plot. Contour Plot works with any contour data. It accommodates rectangular data, nearly rectangular data, and irregular data.